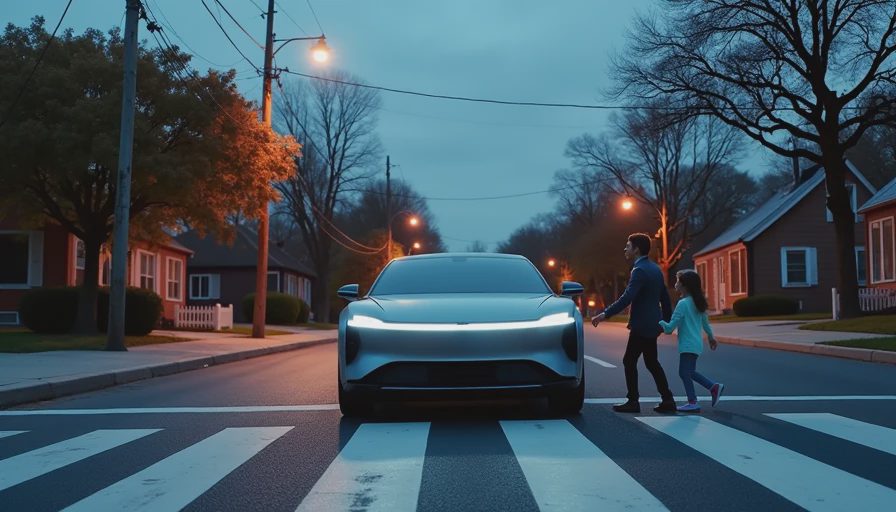
Autonomous vehicle safety is back in the headlines after a string of regulatory actions and a fresh batch of crash data from the National Highway Traffic Safety Administration. Here’s what we know — and what we still don’t — about how self-driving cars stack up against human drivers.
What the Latest NHTSA Data Says
NHTSA’s Standing General Order requires companies testing autonomous vehicles on public roads to report crashes. As of early 2025, the agency has logged over 1,300 incidents involving Level 4 and Level 5 autonomous vehicles. The majority were low-speed rear-end collisions where the autonomous vehicle was stopped or moving slowly. That pattern mirrors early human-driver data, but with a key difference: the autonomous vehicles were almost never at fault in those rear-end crashes. Instead, human drivers were the ones hitting the robotaxis.
The data also shows that serious injuries are rare in AV-involved crashes. In 2024, there were no fatalities reported in collisions where an autonomous vehicle was the primary vehicle. Compare that to the roughly 40,000 traffic deaths in the U.S. each year, largely caused by human error. The early numbers suggest that autonomous vehicle safety may already be improving — at least in the limited operational domains where these vehicles currently operate.
Waymo alone reported over 4 million driverless miles in 2024 across San Francisco and Phoenix. Its at-fault crash rate was about 1.5 per million miles, according to company disclosures. That is well below the human average, though critics note that Waymo’s vehicles rarely face snow, heavy rain, or unmarked roads.
Comparing Human vs. Autonomous Crash Rates
The obvious question: Are autonomous vehicles safer than human-driven ones? The answer depends on how you measure.
A 2024 study from the Insurance Institute for Highway Safety (IIHS) looked at police-reported crashes in areas with heavy autonomous vehicle deployment (San Francisco, Phoenix, and parts of Texas). It found that autonomous vehicles had fewer at-fault crashes per mile than human drivers — but the difference was smaller than proponents had hoped. For every million miles driven, autonomous vehicles had about 2.3 at-fault crashes, versus 3.1 for humans. That’s roughly a 25% improvement, not the 90% reduction some tech companies had forecast.
But the comparison isn't apples-to-apples. Most autonomous vehicles operate in fair-weather conditions, on well-mapped streets, and at speeds below 35 mph. Take them off the grid, and the performance drops. Uber’s fatal Tempe crash in 2018 is a reminder that edge cases — jaywalkers in the dark, construction zones, debris on the highway — remain the hardest challenges.
The Big Unknowns: Edge Cases and Software Updates
Here’s where the data runs out. No public dataset captures how autonomous vehicles handle true edge cases — the kind of split-second decisions human drivers make instinctively. Companies like Waymo and Cruise test extensively, but they don’t release detailed logs of near-misses or disengagement events. NHTSA’s Standing General Order only covers crashes, not the hundreds of times a human safety driver had to take over.
Software updates are another blind spot. When a human driver improves, it’s gradual. When an autonomous system gets an over-the-air update, its behavior can change overnight. That makes long-term autonomous vehicle safety evaluations difficult. A system that passed a test in January could behave differently in February after a new training model is pushed. Regulators are still figuring out how to handle that pace of change.

Why Transparency Matters for Autonomous Vehicle Safety
The autonomous vehicle safety conversation often centers on how many crashes occur, but that misses the point. The real measure is how many potential crashes were avoided — and that data is almost never public. Waymo publishes a safety impact report that includes simulated collision avoidance, but independent researchers can’t verify it with raw logs. Without transparency, regulators and the public are left trusting company self-assessments.
A few states are pushing for more disclosure. California requires AV companies to report disengagements — every time the human safety driver had to take control. In 2024, Waymo reported 0.1 disengagements per 1,000 miles in California; Cruise reported 0.3. But those numbers are only for vehicles with safety drivers, not fully driverless. When the safety driver is removed, there’s no one to hit the brakes — so the system must handle every scenario alone.
How Regulators Are Responding
The National Highway Traffic Safety Administration is tightening requirements. In late 2024, it proposed a rule that would require AV developers to submit "safety self-assessments" at every major software update, not just at initial deployment. The goal is to track how updates affect crash risk over time. The rule is still in the comment period, but it signals that regulators are paying attention to the software-update problem.
State-level oversight is even more uneven. California’s Public Utilities Commission requires detailed disengagement reports, while Arizona and Texas have more hands-off approaches. That patchwork makes it hard for consumers to know what protections exist when a robotaxi pulls up.
What This Means for the Industry
The autonomous vehicle safety narrative is shifting from "when will it be perfect?" to "how does it compare to the human baseline?" That’s a more honest question — and a harder one to answer. The early data suggests that autonomous vehicles are slightly safer than humans in controlled conditions, with far fewer fatal crashes per mile. But until the industry opens up its disengagement data and starts testing in winter weather and unpainted rural roads, we won’t have a full picture.
For now, if you’re riding in a Waymo in Phoenix or a Cruise in San Francisco, the odds are that you’re statistically safer than you would be in a human-driven ride. Just don’t expect that to hold true everywhere — at least not yet.



Travellers Write
No letters yet — be the first traveller to write.